


After the ChatGPT Moment: Measuring AI’s Adoption
How quickly has AI been diffusing through the economy?
In February 2023, ChatGPT made headlines for purportedly being the fastest-growing consumer app in history. It reached 100 million users within two months, years faster than both Instagram and Netflix, making it a clear example of speedy technology adoption.
Two years on, work on AI has been awarded two Nobel Prizes, and major AI companies have collectively grown their annualized revenues over ten-fold to reach multi-billion-dollar scales. Two years is a long time in the world of AI.
With all these changes, it’s time to take a new look at the evidence on AI diffusion. How fast has AI been diffusing throughout the economy? How many people are using AI systems in the US, and how are they doing so?
AI is being adopted faster than most technologies in history
Technologies are being adopted more quickly over time
To put the speed of AI adoption into context, we can first look at data on other technologies as a reference point. Conveniently for us, Nicholas Felton and Karl Hartig prepared a graph that shows this for a range of technologies, ranging from electricity to the internet.
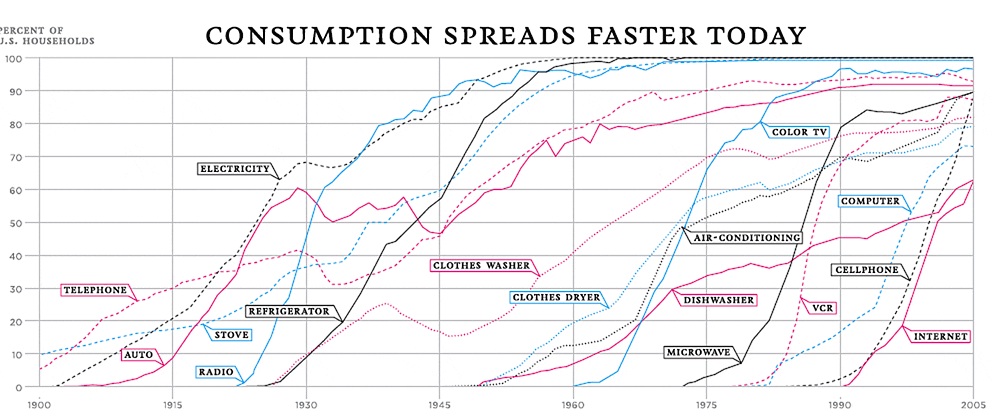
Two things immediately stand out to us about this graph. The first is that many important technologies have taken decades to diffuse to the majority of the population. For example, it took around four decades to go from 0% to 70% of US households adopting electricity. For telephones, it took more like six decades.
The second thing that stands out is mentioned in the title – the time for technology diffusion has been declining over time. Of course, this depends on how we define “diffusion”, but we can use the graph’s data to work out the adoption times at different levels of adoption (e.g. 30% or 70% of US households). This results in the following fitted graph:1

Here we see that there’s been a fairly consistent trend of diffusion getting shorter over time: those technologies that do eventually reach 70% adoption tend to do so faster than they used to. For example, the line of best fit suggests that the time to reach 70% US household adoption fell from around 40 years in 1900 to around 17 years in 2000. Interestingly, the times to reach higher levels of adoption have also been declining faster than for lower levels.
These declines in technology diffusion times are probably driven (at least partly) due to improvements in infrastructure, such as from computer network buildouts or from improved transportation. But regardless of what’s behind these improvements, a naive extrapolation of the trends suggests AI diffusion times to be faster than for most historical technologies.
AI system adoption is likely faster than these historical trends would predict
So how does ChatGPT fare compared to these trend extrapolations? If we extrapolate out trends until 2022 (the year of ChatGPT’s release), we expect a median adoption time of around 10 years, with around 5 years of variation as we change the adoption threshold from 10% to 70%.2 This is fast, but the numbers we saw from ChatGPT are much faster than this.
In particular, ChatGPT was used weekly by 10% of the US population in just under 2 years after its introduction, and used by 30% of the US population about 6 months after that.3 We could also look at daily use instead of weekly use, which implies that ChatGPT was used daily by 7.4% of the US population in March.4 If we further account for user growth since then, as well as all the users across multiple AI labs, it’s plausible that we now have 10% AI adoption even in terms of daily use.5 And although this isn’t quite an apples-to-apples comparison (fraction of individuals vs fraction of US households), these seem sufficiently similar that our core point still stands.

One issue with this is that the data source we’ve been considering has largely focused on especially notable consumer electronics, and it’s debatable whether this is the most informative reference class for thinking about ChatGPT. But even if we compare to more recent technologies, it still seems that AI has been diffusing throughout the economy incredibly quickly. ChatGPT reached 100 million global users within around 2 months, which is faster than almost all other products in history, including consumer apps like Spotify and Netflix.6

This rapid growth also doesn’t seem to be purely specific to ChatGPT. For one, the revenues of OpenAI, Anthropic, and Google DeepMind have all broadly grown several times per year. We can also look at AI adoption by American businesses. For example, Ramp data suggests that the national fraction of businesses paying for AI products is approaching 40%, and naively fitting a sigmoid to their data suggests that this will extend to ~80% of businesses by 2028.7

The upshot is that it seems very plausible that AI has been adopted faster than almost all technologies in history.8
Average AI use has likely been increasing, but it’s unclear by how much
In the previous section, we look at how many people have been using AI over time. But this is only part of the story – to really understand how quickly AI diffusion has been occurring, we also need to know how and how much each person uses AI on average. For example, are people using frontier models? How many tokens are they generating each day? And what do surveys suggest about average AI use?
Most users don’t use state-of-the-art AI systems very much, and the fraction of users that do has likely been declining
First of all, we know that most users probably aren’t using frontier models very intensively. As of April 2025, only ~5% of users had paid ChatGPT subscriptions, so the remaining ~95% were primarily using free-tier models like 4o or 4.1-mini. These free-tier models usually fall far short of the state of the art, or in the cases where the best models are provided, free usage is typically highly rate-limited.9
But the story is likely to be different with paying users, who are much more likely to be using the best models available. One way to see this is to look at OpenRouter data. For example, if we look at the weekly token usage for Anthropic models, we see that pretty much all paid API token usage shifts to the latest model within 2 months.10 11 A big part of this is that the newest AI systems can be plugged almost immediately into existing infrastructure, allowing quick access to new frontier AI capabilities.

To link this back to changes in AI usage intensity, we need to look at how the numbers of paying and free-tier users have been changing over time. Public reports from The Information suggest that while the absolute number of paying users has been increasing, the fraction of paying users probably isn’t. If anything, it’s probably been decreasing over time, at least for ChatGPT:

One might conclude from this that AI systems aren’t being used that much more on average, but we think this would be a bit of a stretch because it also depends on the distribution of usage intensity. For example, it could be that both free-tier and paid users are increasing their token usages over time. Distributional effects also matter – for instance, even if free-tier users were to slightly decrease their token usage, paid users could increase their token usage enough to compensate for this.
The average number of tokens processed per user has probably been growing a lot
What the previous subsection suggests is that we should also directly look at how the number of tokens per user has been growing over time.
We can once again try to estimate this based on public statements. In October 2024, Sam Altman tweeted that there had been a “50x increase in token volume across our systems” relative to OpenAI’s last “devday” event in November 2023. Over the same time period, the number of ChatGPT users increased around 2.5x to 3x, and it seems unlikely that the total number of consumers of OpenAI products (including API usage) would’ve grown substantially faster than this. As a result, it seems plausible that there may have been an up to 20x increase in token volume per user on average from late 2023 to late 2024.
That said, from the tweet alone it’s not entirely clear what “token volume” was referring to – does this refer to input tokens, output tokens, or both? Some of this increase in token volume per user could also be due to model responses getting longer, which aren’t directly due to changes in user behavior (though note that Altman’s statement predates reasoning models, which significantly increased growth). In any case, this provides some evidence for a notable increase in how much AI systems have been used over time.
Surveys provide mixed evidence about increases in the frequency of AI use
On the other hand, there’s also general population survey data from the Pew Research Center that seemingly goes against this. The results showed very little movement in the self-reported frequency of interaction with LLMs between 2022 and 2024.

We found this result surprising, though it’s unclear to us how much we should update on it. For one, a separate Gallup poll from June 2025 finds a different result, where “frequent AI use (a few times a week or more) has also nearly doubled, from 11% to 19% since Gallup’s first measure in 2023.”
There may also be complications due to sampling biases. AI systems are being adopted a lot more quickly in some jobs than others, and it’s possible that survey respondents are skewed towards one group in an unrepresentative way.
Overall verdict
Looking at all the above evidence, we think it’s fair to say that AI diffusion has been faster than for almost all technologies in history. Our best guess is also that there have been substantial increases in how much individuals use AI over time as well. For example, per-user token volumes plausibly grew more than 10x over 2024, though the evidence is somewhat harder to interpret.
But we’ve only scratched the surface about AI diffusion. Most saliently, we’ve only looked at what’s happened so far, but there’s still the looming question of what happens next: how likely is it that existing rates of diffusion will persist?
Answering this question brings up a whole new range of considerations. There are regulatory constraints, and costs due to a lack of knowledge about how to effectively use AI systems. There may be bottlenecks in the amount of compute available for inference, as well as the need for massive complementary investments and organizational restructuring. We might also need to look more and more at apps powered by APIs, instead of focusing on ChatGPT. But this is a topic for another day.
In our fits we only keep the datapoints that meet all of the 10%, 30%, 50%, and 70% criteria. This for example means dropping technologies like the internet, which had not reached the 70% threshold in the available data going up to 2005. Note that this introduces a selection bias, since not all technologies reach all the thresholds (e.g. not everyone has a waffle iron), but it doesn’t substantially change our conclusions.
In particular, naively extrapolating the trends suggests that we should expect median adoption times for ChatGPT of 10% in about 8 years, 30% in about 10.5 years, 50% in about 12 years, and 70% in about 13 years. This is assuming that ChatGPT is in the same reference class as the other technologies that we’re considering.
To estimate weekly active users in the US, we combine the fraction of ChatGPT website visits which are US-based with reported ChatGPT weekly active users.
This is based on a daily active user count of 160 million. We then multiply by the fraction of overall ChatGPT website visits that are from the US of 15.7%, and divide by the US population of 340 million to get 7.4%.
We assume a fraction of US-based daily active users equivalent to the fraction of US-based website visits.
As far as we can tell, the most plausible exceptions to this are Pokémon Go and Threads. The Pokémon Go example is somewhat debatable because (in contrast to ChatGPT) it involves reaching 100 million downloads rather than monthly active users.
This is based on Ramp’s corporate credit card statement data.
One possible counterargument is that the definition of “AI” is unclear. In particular, why should we choose to look at the release of ChatGPT as a key reference point for the diffusion of AI? Why not anchor to GPT-3 or transformer models more generally? One could even argue that “language models” are the more relevant “technology”, resulting in a multi-decade long diffusion period. There’s certainly some truth to this, but we shouldn’t take this too far. First, it seems unreasonable to anchor to language models prior to ~2020, since these models were much worse and less useful than the models of today. We could anchor to the release of GPT-3, but this would only add on two years to our initial estimate for the time it takes to reach 100 million users, which is still faster than the extrapolated trends would suggest. We could also anchor to transformer models more broadly, but it’s unclear how to interpret the data we do have about this. For example, Logan Kilpatrick suggests that Google was using transformer models to power Google Search at multi-billion-user scale, even before the current wave of “generative AI” systems.
For example, see the rate limits for Gemini 2.5 Pro, o3(-mini), and Claude (Sonnet) 4. These typically involve limits on the number of requests per minute or day, in addition to only allowing models to be used in certain countries.
Things are unfortunately less clear with data from Google DeepMind’s Gemini models. For instance, Gemini 2.0 Flash continues to be the most common model despite several versions of Gemini 2.5 being released (e.g. Gemini 2.5 Flash, Gemini 2.5 Flash Lite Preview 06-17, Gemini 2.5 Pro Experimental, etc.). That said, Gemini 2.0 Flash’s share of “Gemini-model-generated-tokens” went from 100% to less than 50% within about a month since the first Gemini 2.5 models were released.
 | A guest post by
|
Great post! Would it be useful to look into how fast the economic value from AI as a fraction of the gross world product has grown in comparison with other tecnologies?